


| *If Data Analysis... is not present under the Data tab, it will need to be added by following these instructions. |
Since observations are affected by random errors, and therefore have an associated statistical uncertainty, then the gradient and y-intercept of any determined line of best fit will also have errors. The following procedure (using the data used in the Adding Experimental Data and Plotting Graphs sections of this tutorial) details how these can be calculated.
| 1. | Select the Data tab and click on Data Analysis*. | |
| 2. | Scroll down the list and select Regression and then click on OK. | |
| 3. | Make sure the cursor is flashing in the window to the right of Input Y Range:. Enter the cell addresses for the data plotted along the y-axis of your graph in this window (i.e. by clicking and dragging down the column B2 to B8). | |
| 4. | Click in the window to the right Input X Range:. Enter the cell addresses for the data plotted along the x-axis of your graph in this window (i.e. by clicking and dragging down the column A2 to A8). | |
| 5. | Under Output options, click on the circle to the left of Output Range: | |
| 6. | Make sure the flashing cursor is in the window to the right of Output Range: | |
| 7. | Click on the cell A10 in the spreadsheet. This address should appear in the window to the right of Output Range: - This is where the regression analysis results table will appear on the sheet. | |
| 8. | Click on OK. | |
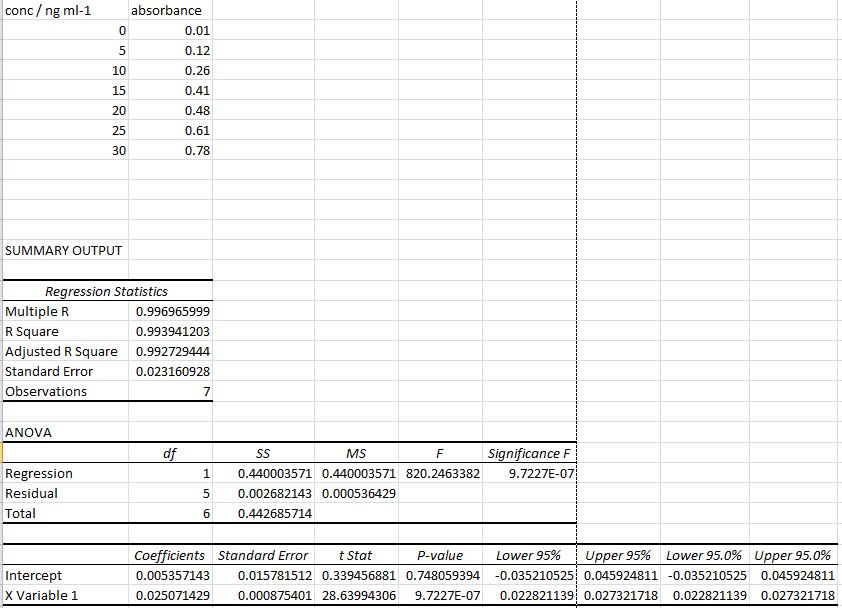
| 9. | Your spreadsheet should now look identical to that shown below. | |
| ||
This procedure has produced the formal statistics for the calculation of the line of best fit. Most of the information here is beyond the scope of this introductory workshop. However, you should pay attention to the values of the Coefficients, Lower 95% and Upper 95% for the Intercept and X Variable.
The coefficient of the intercept corresponds to the value of the y-intercept of the line of best fit, and the Lower 95% and Upper 95% of the intercept are its corresponding statistical uncertainty (i.e. 95% Confidence Limits).
The coefficient of the X Variable corresponds to the gradient of the line of best fit, and the Lower 95% and Upper 95% on the X Variable are its corresponding statistical uncertainty (i.e. 95% Confidence Limits).
For the data in this example we therefore have:
The difference between the limits and the actual value can then be determined (in this case 0.025-0.023=0.002 and 0.028-0.025=0.003) and the larger of these two differences should be quoted as the error, e.g. for the above case Gradient = 0.025 ± 0.003 ml ng-1.