Background Theory
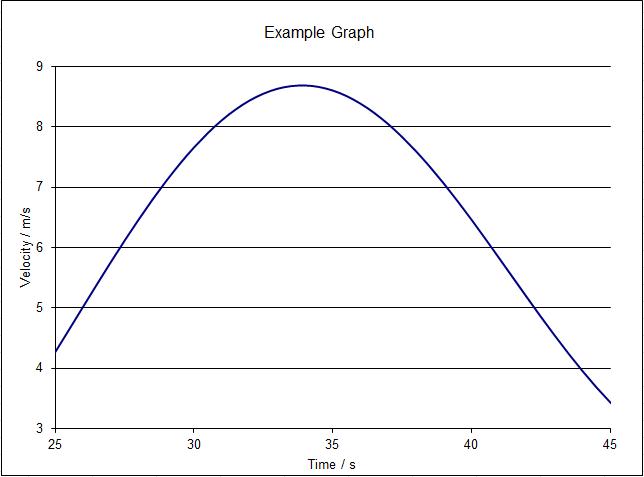
Determining the area under a curve is a means of integrating the function of that curve, since the area is given by a single definite integral.
Finding the area underneath a curve between two limits is the same as calculating the definite integration of the curve between the same limits.
Rather than determining the explicit integral, the area underneath a curve can be calculated numerically using rectangles and summing their areas.
Midpoint Rectangles
This method uses the height equal to the function as the midpoint of each rectangle; it being assumed that the midpoint provides a valid approximation of the average height of the function for each strip.
The area of the rectangles can be calculated and summed to estimate the total area. The most accurate area underneath the curve is gained when the width of the rectangles tends to zero, this would be exactly equivalent to the explicit integral.
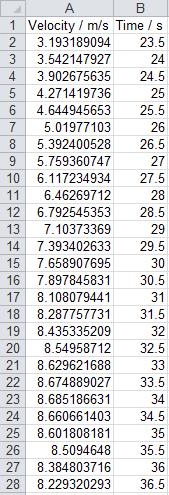
To use Excel to perform a Numerical Intgeration by determining the area under a curve:
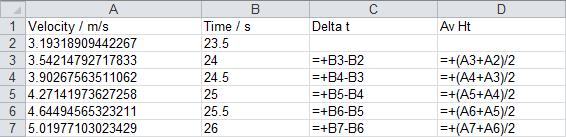
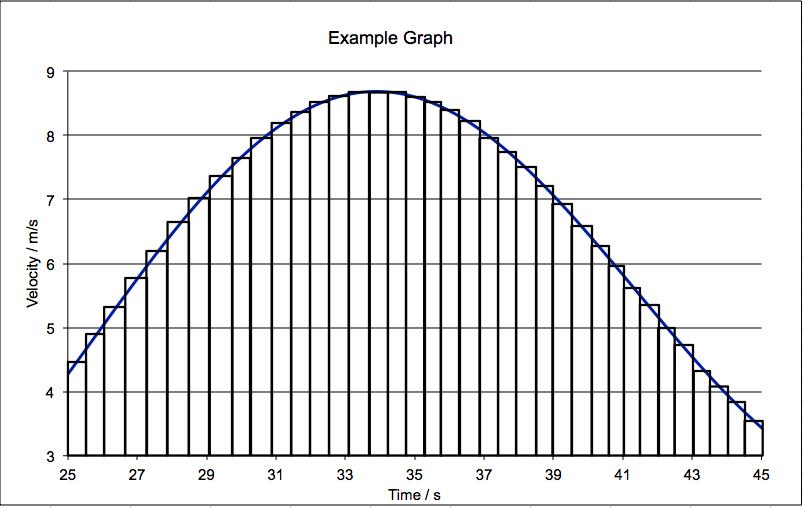
The x intervals and average heights define a set of strips (or rectangles) that approximate to the shape of the area under the curve, as illustrated below
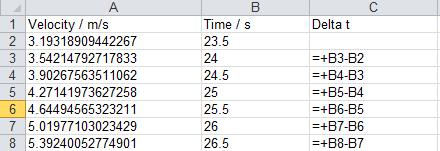
However, in order to do this we must know any limits over which we wish to integrate. For this example we are going to integrate over the full range of x-values for the data, but only determine the area where velocity > 5 m/s, i.e have a lower y-limit of 5 m/s. We do this by subtracting 5 from the average heights.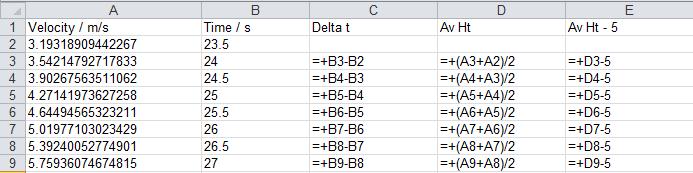
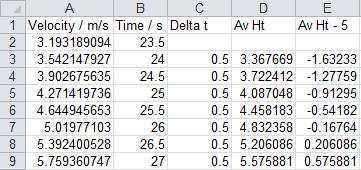
It can be seen in this example that this gives rise to negative heights. These will not be used in the remainder of the calculation since they represent areas outside the lower y-limit of 5 m/s.
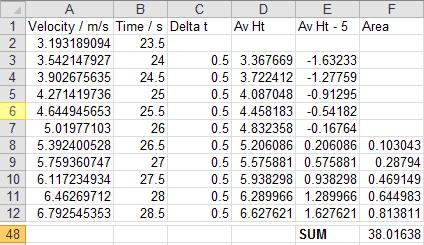
Note 1: The summation can be performed by adding the areas together as a formula (i.e. =+F8+F9+F10+F11+F12) or by using the SUM function (i.e. =SUM(F8:F12)).
Note 2: The units of the area under the curve will be (x-units)x(y-units), so in this example s x m/s = m.
Additional Note: If we had also wished to integrate for a limited range of x-values, then we would only have summed the rectangle areas between the desired x-limits.